


simplify the management of
your real estate assets
AUTOMATICALLY INTEGRATE YOUR INVOICES
Increase efficiency thanks to the automatic integration of your energy bills. Simplify your invoice control and reduce the mission of the department concerned.
EASILY INSTALL, CONNECT AND UPDATE
From your installation to the platform, we directly connect our professional sensors, with a minimum of intervention to be carried out on existing electrical networks. The gateways allow communication with the web interface in several ways: ethernet cable, 3G/4G, Wi-Fi, Modbus, Lora. Finally, you don’t have to worry about the scalability of the platform or its updates. It is the solution itself that manages them.

QUICKLY DISCOVER ACCESSIBLE POTENTIAL SAVINGS
After a few days or a few weeks, identify the main malfunction, unnecessary consumption and the most consuming uses. The consumption level per m2 indicates the priority sites where to intervene.
a web platform for energy management
Multi energies, multi sensors and multi sites

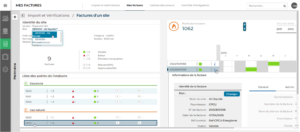
DISPLAY ALL OF YOUR REAL ESTATE ASSETS
View all the energy data and analysis of your different buildings, factories and sites from the same interface. All heritage is instantly visible and accessible.

ENVIRONMENTAL DATA
Accessible and straightforward data recovery without royalty: weather data, temperature, humidity, sunshine, precipitation, wind.

VIEW THE CONSUMPTION OF YOUR DIFFERENT ENERGIES
Analyze the consumption of all your energies (water, gas, electricity, steam, heat, compressed air). Discover your load curves and your consumption invoices. Visualize the abnormal consumption. Create groups by use or by zone with the flexibility of customizing your dashboard. This information is available and updated on the platform for extracts on-demand or to fill a report.
visualize and analyze your energy consumption
from anywhere and in real time

INTEGRATE MULTIPLE DATA FOR AN ENLARGED VISION
Environmental data: thanks to connected sensors compatible with data+, you can always keep an eye on the main building’s life parameters: temperature, humidity, brightness, air quality, etc. for an enlarged view of your consumption
Contextual data: integrate the data of your real estate assets (m2, workforce, occupancy, etc.) into the platform for a rationalized view of your consumption.

VISUALIZE THE ENERGY PRODUCTION OF YOUR FACILITIES
You can control the self-production of your generators: photovoltaic installation, co-tri generation, hydroelectric installation, generators, etc.

COMPARED, BENCHMARKED, CORRELATED
Over the long term, you can analyze your consumption:
– by comparing them on averages and thus identifying a trend,
– by comparing them with each other on the basis of time series,
– by putting them into perspective with data such as the outside temperature, the turnover achieved or the number of parts produced.
visualization of electricity consumption
as close as possible to uses

ELECTRICAL CONSUMPTION PER USE
For a more detailed view by use, Inovadea exclusively offers the GreenStick solution: small size sensors to be stuck on the breakers. This non-intrusive solution fits into all existing panels on the market.
For a very detailed view of your electricity consumption by use and by equipment.
create alarms to be informed in real time
and edit reports for a personalized follow-up
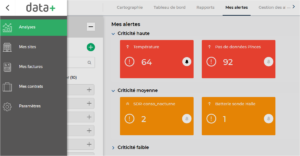
CREATE ALARMS TO BE INFORMED IN TIME OF ANY MALFUNCTIONS
This is one of the platform’s basic functions, which allows you to send notifications, texts or emails to company managers when abnormal consumption is detected or any setting that is outside the scope. For a complete follow-up in complete safety.

EASILY EDIT REPORTS AND PROMOTE THE WORK BEGINNING
The dedicated platform allows you to create report templates and automatically generate them when you need them to feed your audit, diagnosis and action plan.
reduce your energy consumption
and answer to the regulations

REALIZE SAVINGS BY INVESTING IN A PROPORTIONAL WAY TO YOUR CHALLENGES
The data+ platform is gradual in use. You can simply follow your load curve at the 10 minutes point to make sure your contract is consistent. Once every two times, it is possible to reduce the level of the subscription purchased.
You can then instrument the 20/80 uses or even more finely with the GreenStick solution to identify unnecessary consumption and leaks.
Our solution allows consumption saving of 10% to 40% depending on the uses and circuits equipped. Under the best conditions, the ROI can be less than one year.

“READY” TERTIARY DECREE
The Data+ platform is already compatible with the requirements of the tertiary decree. Widgets are available to track goals that can be achieved. The direct connection with the Operat platform is operational.